Accuracy you can check yourself
Twenty-seven lenders.
Half a second.
And we’ll show you the working.
Every serviceability tool claims to be accurate. Almost none will show you. So we took a deliberately ugly deal, priced it across the panel in AutoCalc, then opened each lender’s own spreadsheet and put the two numbers side by side — down to the cell reference, so you can open the same file and check us.
We didn’t pick an easy one
A clean PAYG single would prove nothing — every calculator gets those right. This is the kind of file that actually costs you an afternoon: variable income in four flavours, four rentals split between two names, study debt on both, and a three-loan structure with an interest-only leg. Exactly where lenders stop agreeing with each other.
Couple, three dependants, buying at 75% LVR
- Applicant 1
- $210,000 base
+ bonus, overtime, commission, allowance - Applicant 2
- $145,000 base
+ bonus, overtime · essential worker - Rentals
- 4 properties
split 60/40, 4 existing mortgages - Study debt
- HECS on both
$22,000 and $35,000 - New lending
- $1,050,000
3 loans, one interest-only - Security
- $1,400,000
owner-occupied, NSW 2060
Enter it once. See the whole panel.
One pass, every lender ranked, live as you type — maximum capacity, surplus, rate, DTI and the living-expense benchmark side by side. The alternative is opening two dozen spreadsheets and keying the same case into each. These are the rows we take apart, cell by cell, below.

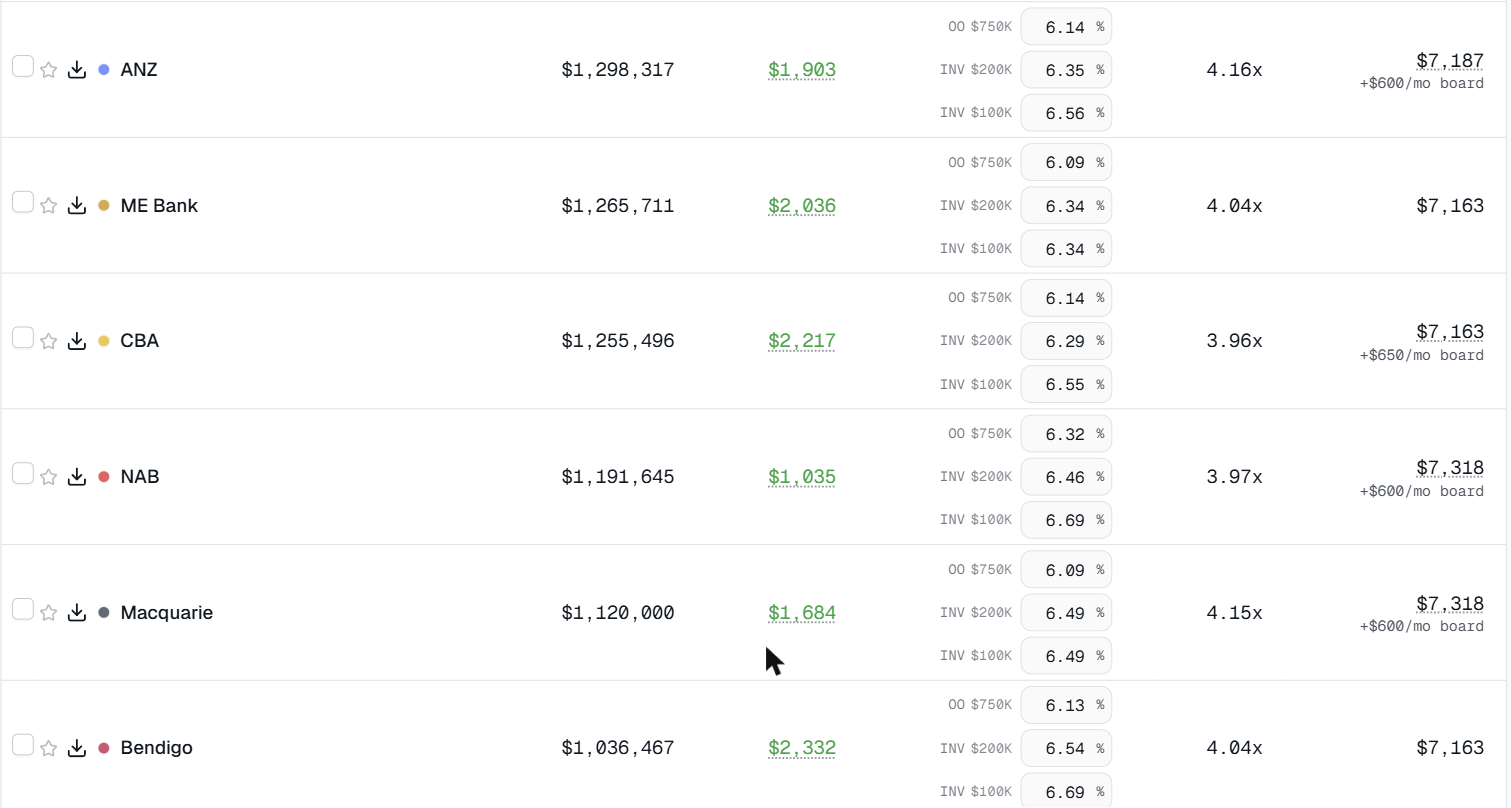
Live output from the AutoCalc portal, 4 Aug 2026. Six of the lenders priced on this case.
Now open the lender’s own spreadsheet
No recreation, no screenshot of our own screen dressed up as theirs. Each panel is a picture of the real cells in that lender’s workbook after it recalculated our case — their labels, their formatting, their numbers. The cell reference is printed beside each one.
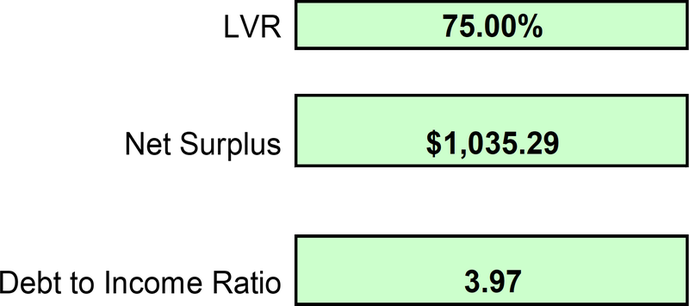
NAB
Calculator!F123 · F127 Matches to the centAutoCalc
What the broker sees in the results table
| Surplus (UMI) | $1,035 |
| Debt to income | 3.97x |
| LVR | 75.0% |
NAB's spreadsheet
Cells read back after the workbook recalculated
Macquarie
Serviceability Worksheet!K46 · K48 ExactAutoCalc
What the broker sees in the results table
| Maximum capacity | $1,120,000 |
| LVR | 75.00% |
Macquarie's spreadsheet
Cells read back after the workbook recalculated

CBA
Model!F62 · F63 · K63 Same decision, same DTIAutoCalc
What the broker sees in the results table
| Serviceable | Yes |
| Debt to income | 3.96x |
| Surplus (UMI) | $2,217 |
CBA's spreadsheet
Cells read back after the workbook recalculated


And again, for every other lender
Not a hand-picked best case — the same check, lender after lender, across every spreadsheet-based lender on the panel. Our figure on the left, the lender’s own cell on the right. Every one of the cells below sits on a sheet the lender puts in front of brokers, so you can open that workbook yourself and land on the same reference.

Resimac states this annually — $98,641 ÷ 12 = $8,220 a month

















Every figure, unrounded
No rounding to hide behind. 45 figures at full precision, each against the cell it came from. A figure only appears here if the portal, the calculation engine and the lender’s workbook all agree it is comparable — nothing is quietly excluded to flatter the total.
| Lender | Figure | AutoCalc | Lender's workbook | Cell | Difference |
|---|---|---|---|---|---|
| Resimac | Surplus (UMI) | 8,220.08 | 8,220.08 | Calculator!C89 ÷ 12 | under a cent |
| Brighten | Maximum capacity | 1,970,000.00 | 1,970,000.00 | Servicing Calculator!D89 | nil |
| Brighten | Surplus (UMI) | 6,951.51 | 6,951.53 | Servicing Calculator!D85 ÷ 12 | $0.02 |
| Brighten | Debt to income | 4.1422 | 4.1422 | Servicing Calculator!D91 | nil |
| Bluestone | Surplus (UMI) | 5,162.53 | 5,162.72 | Serviceability!AC195 | $0.19 |
| Auswide | Maximum capacity | 1,552,365.91 | 1,552,375.03 | MASTER!C608 internal — see note | $9.12 |
| Auswide | Surplus (UMI) | 4,118.26 | 4,118.00 | 'Serviceability Test'!D183 | $0.26 |
| Bank of Sydney | Maximum capacity | 1,412,067.00 | 1,412,045.86 | Serviceability Calculator!AE46 | $21.14 |
| Bank of Sydney | Surplus (UMI) | 3,108.00 | 3,107.87 | Serviceability Calculator!U43 ÷ 12 | $0.13 |
| Bank of Sydney | Debt to income | 4.0387 | 4.0387 | Serviceability Calculator!AC39 | nil |
| ANZ | Maximum capacity | 1,298,317.00 | 1,298,314.06 | SoP 1!G200 | $2.94 |
| ANZ | Surplus (UMI) | 1,902.75 | 1,902.74 | SoP 1!S198 | $0.01 |
| ME Bank | Debt to income | 4.0387 | 4.0387 | Results!C42 | nil |
| CBA | Maximum capacity | 1,255,496.00 | 1,255,406.00 | Model!G68 | $90.00 |
| CBA | Surplus (UMI) | 2,217.30 | 2,215.22 | Model!K63 | $2.09 |
| CBA | Debt to income | 3.9562 | 3.96 | Model!F63 | nil |
| NAB | Surplus (UMI) | 1,035.29 | 1,035.29 | Calculator!F123 | under a cent |
| NAB | Debt to income | 3.9706 | 3.9706 | Calculator!F127 | nil |
| Macquarie | Maximum capacity | 1,120,000.00 | 1,120,000.00 | Serviceability Worksheet!K46 | nil |
| Macquarie | Surplus (UMI) | 1,683.77 | 1,683.77 | Serviceability Worksheet!K257 ÷ 12 | $0.01 |
| Macquarie | Debt to income | 4.1497 | 4.15 | Serviceability Worksheet!K261 | nil |
| Bendigo | Debt to income | 4.04 | 4.04 | Net Surplus Calculator!I140 | nil |
| UBank | Surplus (UMI) | -788.24 | -789.68 | Serviceability Calculator!D106 | $1.44 |
| UBank | Debt to income | 3.9706 | 3.97 | Serviceability Calculator!D107 | nil |
| MyState | Maximum capacity | 743,609.00 | 743,620.79 | MASTER!C591 internal — see note | $11.79 |
| MyState | Surplus (UMI) | -2,539.06 | -2,538.00 | Serviceability Test!D183 | $1.06 |
| MyState | Debt to income | 4.0534 | 4.05 | Serviceability Test!E206 | nil |
| AMP | Maximum capacity | 673,813.66 | 673,813.90 | Customer view page!N108 | $0.25 |
| AMP | Surplus (UMI) | -2,900.54 | -2,900.54 | Customer view page!E114 | under a cent |
| AMP | Debt to income | 4.1497 | 4.1497 | Customer view page!E116 | nil |
| St.George | Surplus (UMI) | -7,949.96 | -7,949.98 | Serviceability!AN291 | $0.02 |
| St.George | Debt to income | 4.0387 | 4.04 | Serviceability!AN294 | nil |
| Bank of Melbourne | Surplus (UMI) | -7,949.96 | -7,949.98 | Serviceability!AN291 | $0.02 |
| Bank of Melbourne | Debt to income | 4.0387 | 4.04 | Serviceability!AN294 | nil |
| BankSA | Surplus (UMI) | -7,949.96 | -7,949.98 | Serviceability!AN291 | $0.02 |
| BankSA | Debt to income | 4.0387 | 4.04 | Serviceability!AN294 | nil |
| Westpac | Maximum capacity | 114,836.00 | 114,836.33 | Serviceability!AN303 | $0.33 |
| Westpac | Surplus (UMI) | -8,007.38 | -8,007.40 | Serviceability!AN291 | $0.02 |
| Westpac | Debt to income | 4.0387 | 4.04 | Serviceability!AN294 | nil |
| Bankwest | Maximum capacity | 976,842.26 | 977,393.29 | Calculator!AJ156 | $551.03 |
| Bankwest | Surplus (UMI) | -618.36 | -613.70 | Calculator!CA61 ÷ 12 | $4.66 |
| Bankwest | Debt to income | 4.1195 | 4.1195 | Calculator!CB84 | nil |
| MA Money | Maximum capacity | 1,724,539.21 | 1,724,539.65 | Residential!F370 | $0.44 |
| MA Money | Surplus (UMI) | 5,174.01 | 5,174.01 | Residential!F366 | under a cent |
| MA Money | Debt to income | 3.9562 | 3.9562 | Residential!F368 | nil |
A note on the two Auswide and MyState rows. Every other cell above is one a broker opens and reads. Those two are not. Both workbooks work out a maximum borrowing figure internally, then deliberately leave the on-screen estimate blank whenever a new investment loan claims deductible interest — as this case does, twice — because the estimate cannot allow for the way negative gearing feeds back into the income. So there is no broker-facing cell to point at, and we compared against the internal one instead. We would rather say that than quietly drop two rows.
Run your own file through it
This is one case. Bring the deal that has been sitting on your desk — the messy one with the trust, the three rentals and the casual income — and see the whole panel in the time it takes to read this sentence. Then open the lender’s spreadsheet and check us.
Try it on your next deal Every lender on the panel · live results as you type
Important information
The figures on this page come from a single verification run on 4 August 2026, using one of the 180-plus test scenarios we run across the panel — several thousand lender-by-lender comparisons in all. They are published to show how AutoCalc is tested. They are not a representation, warranty or guarantee about the results AutoCalc will produce for any other scenario, at any other time, or for any particular client.
Lender workbooks, assessment rates, credit policies and product settings change without notice. A figure that agreed on the date shown may not agree today.
AutoCalc produces indicative serviceability estimates for use by licensed mortgage professionals. It is not an offer of credit, a pre-approval, a credit quote or credit assistance, and it does not take account of any person’s objectives, financial situation or needs. Nothing on this page is financial, credit, tax or legal advice. Every result must be confirmed with the lender — including in the lender’s own calculator — before it is relied on or passed to a client.
We identify lenders by name only — we do not display their logos or branding. Lender names and trademarks are the property of their respective owners and are used here solely to indicate which lenders’ calculators AutoCalc supports. AutoCalc is an independent tool and is not affiliated with, endorsed by, sponsored by, or partnered with any lender listed, and its calculators are independently developed — they are not provided by, or copied from, the lenders’ own software. No lender has reviewed or approved this page.
To the maximum extent permitted by law, BrokerFit Pty Ltd accepts no liability for any loss or damage arising from reliance on this page. Use of AutoCalc is governed by our Terms of Service and Privacy Policy.